|
1
|
- Luis O. Tedeschi* - Texas A&M University
- Antonello Cannas - Sassari University
- Danny G. Fox - Cornell University
|
|
2
|
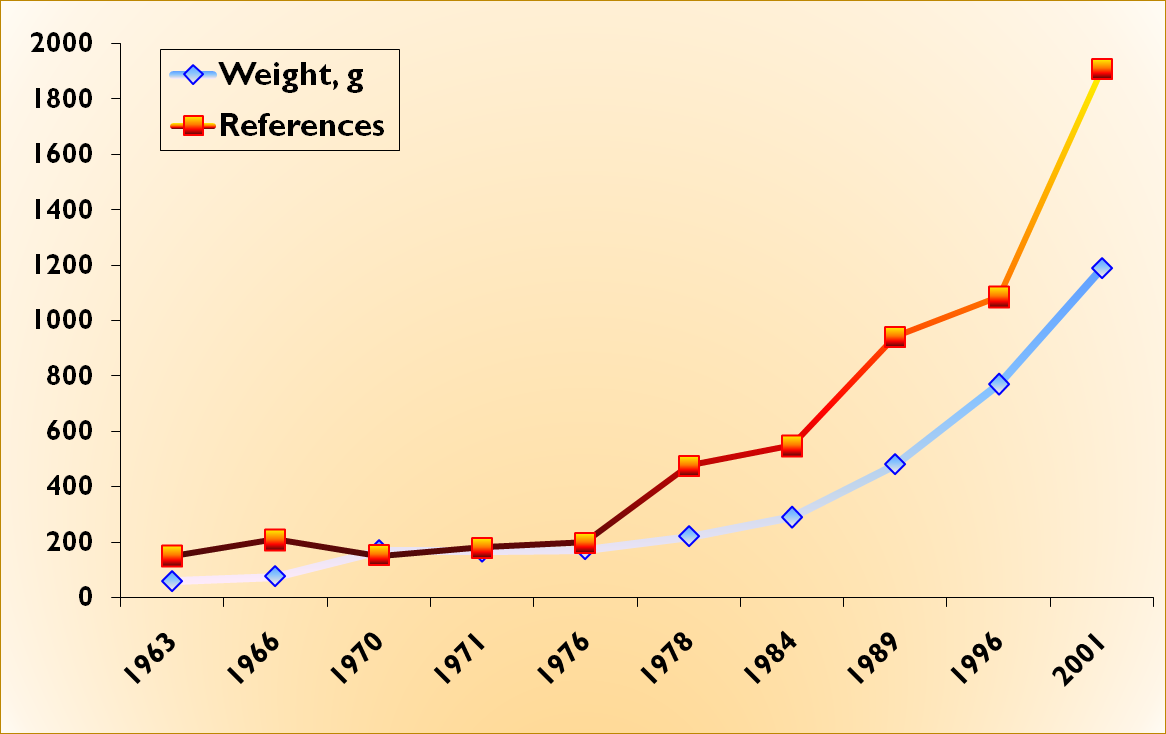
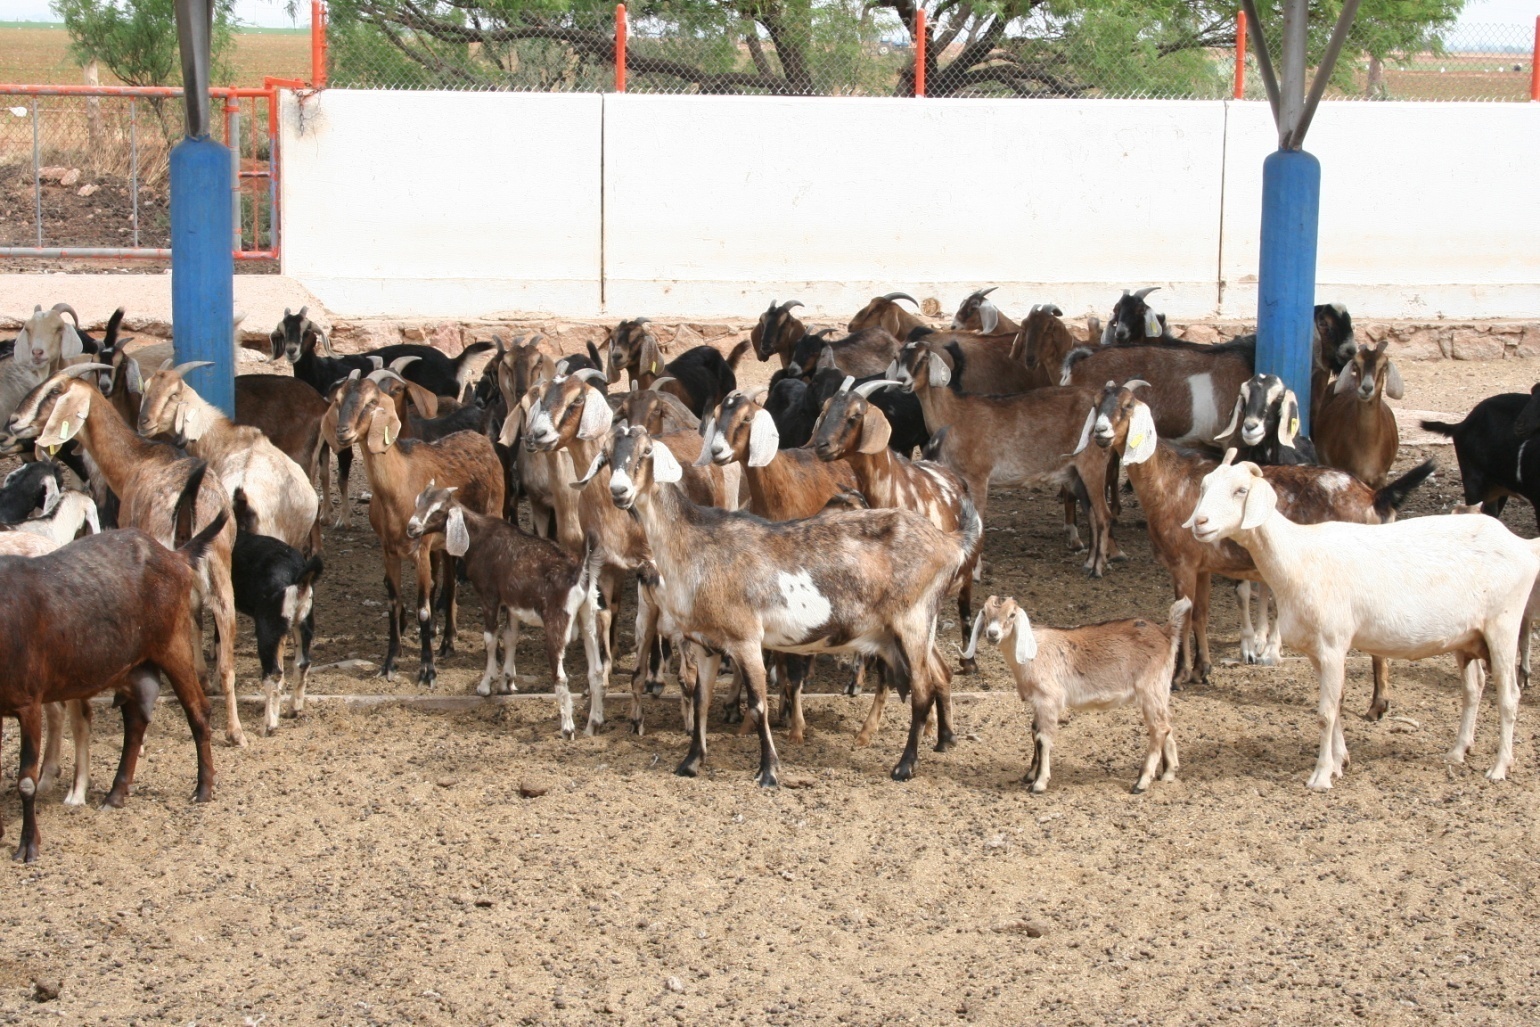
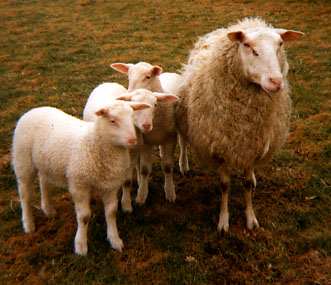
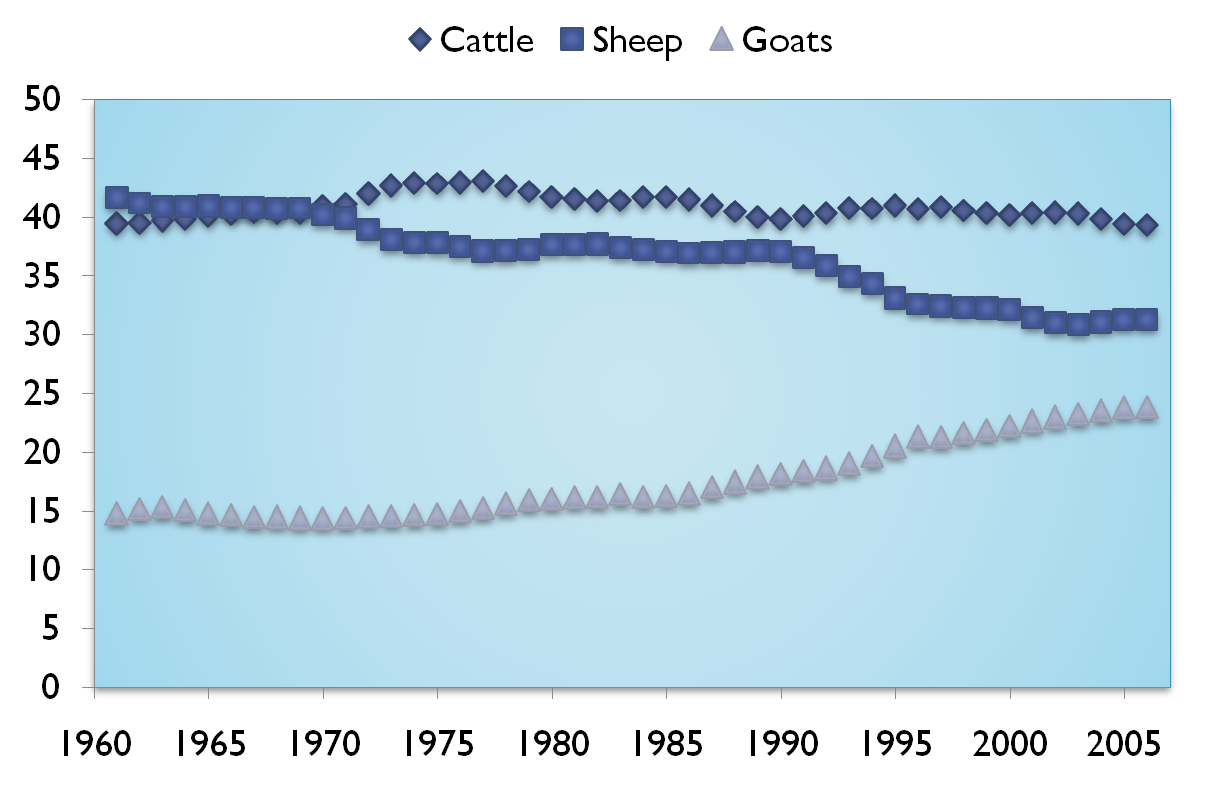
- There are wide variations in animal types, feeds and environments used
in ruminant production
- There are many variables to account for
- Biological processes and equations needed to describe each are complex
- Interactions are complex…
|
|
3
|
|
|
4
|
|
|
5
|
|
|
6
|
|
|
7
|
|
|
8
|
|
|
9
|
|
|
10
|
- INRA
- dairy & meat à
sheep and goats
- AFRC and CSIRO
- meat & wool à
sheep
- dairy à goats
- NRC
- meat, wool, dairy à
sheep
- dairy, meat, indigenous à goats
|
|
11
|
- 1980
- Fox et al. (1982) – Net protein
- Fox and Black (1984) – Requirements
- Sniffen et al. (1987) – Protein supply
- Fox et al. (1988) – Environment adjustments
- 1991
- Cornell Net Carbohydrate and Protein System (CNCPS), version 1
|
|
12
|
- 1993 (version 2)
- Fox et al. (1993) – Search report
- 1994 (version 3)
- Excel spreadsheet
- Beef NRC (1996) is based on this version
- 2000 (version 4)
- Microsoft Visual Basic 6.0
- Dairy NRC (2001) has some components
|
|
13
|
- 2003 (version 5)
- Microsoft Visual Basic .NET
- Fox et al. (2004, Anifeed)
- 2004
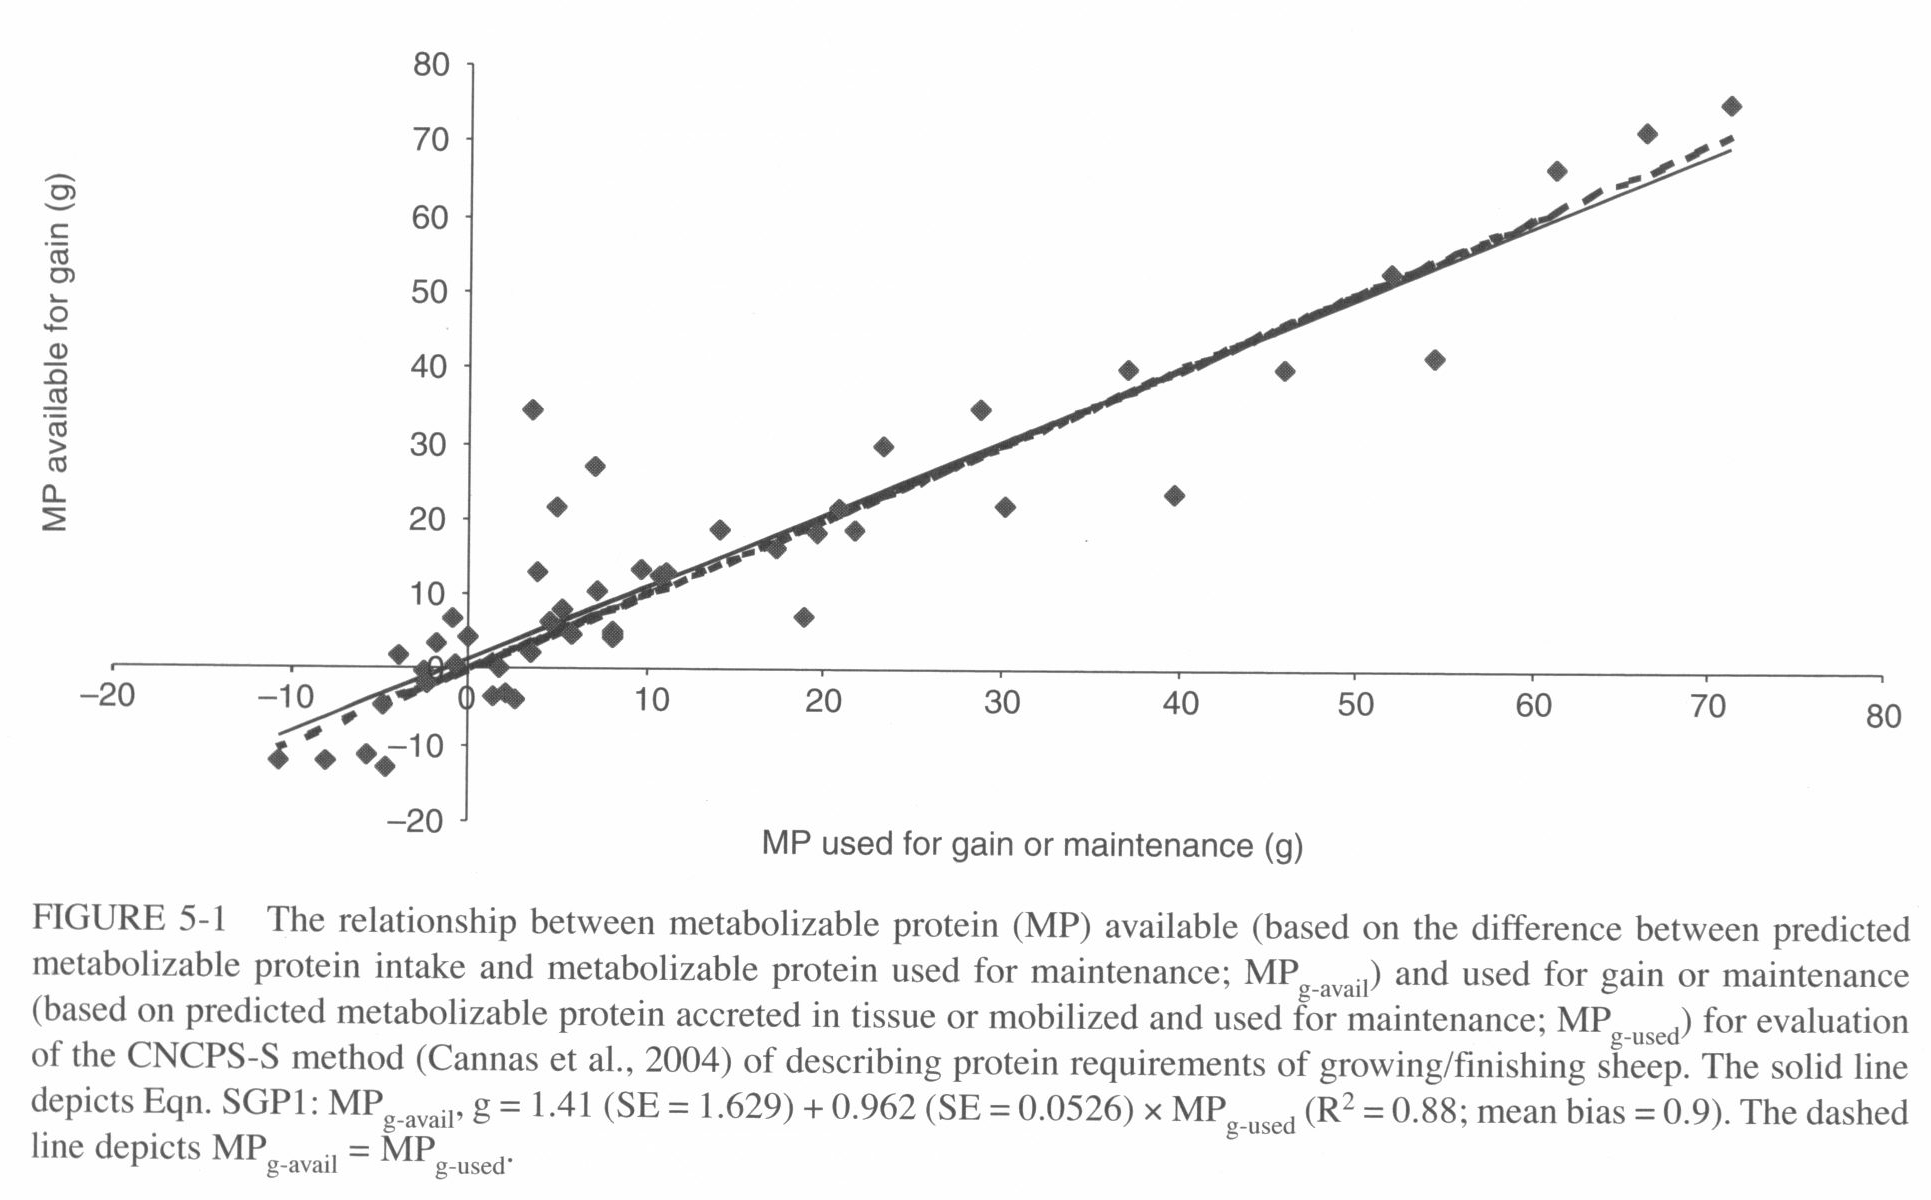
- Cannas et al. (2004)
- CNCPS Sheep (CNCPS-S)
|
|
14
|
- 2005
- Small Ruminant Nutrition System (SRNS Sheep)
- 2006
- SRNS includes Sheep and Goats
- 2007 and on
- Development of the Ruminant Nutrition Management System (RNMS)
- Cattle (beef and dairy), Sheep, and Goats
- Static and dynamic models
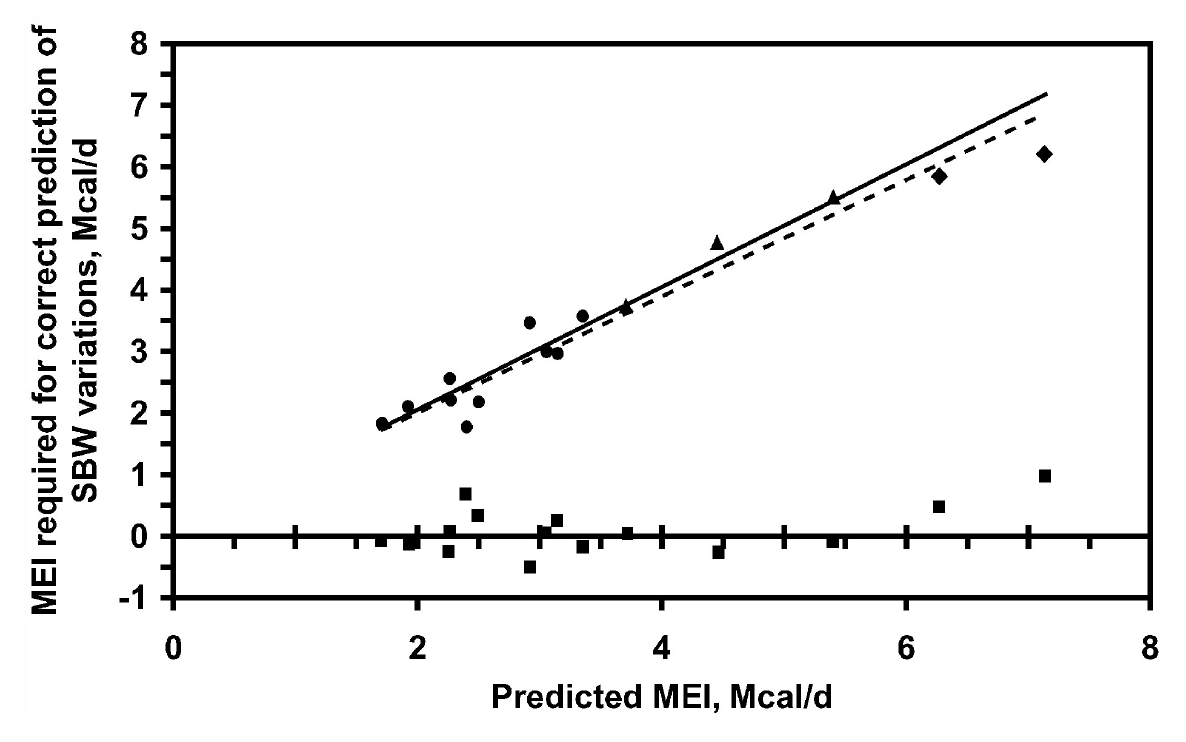
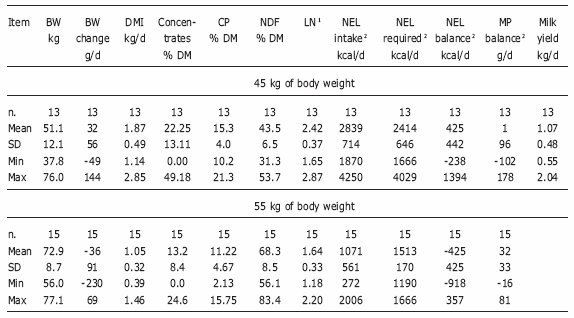
|
|
15
|
|
|
16
|
- Step 1 – Accurate prediction of requirements of energy and nutrients
- Step 2 – Accurate estimation of diet supply of energy and nutrients
- Step 3 – Thorough validation of the equations and evaluation of the
model
- Step 4 – Re-design and re-engineer the model to improve adequacy
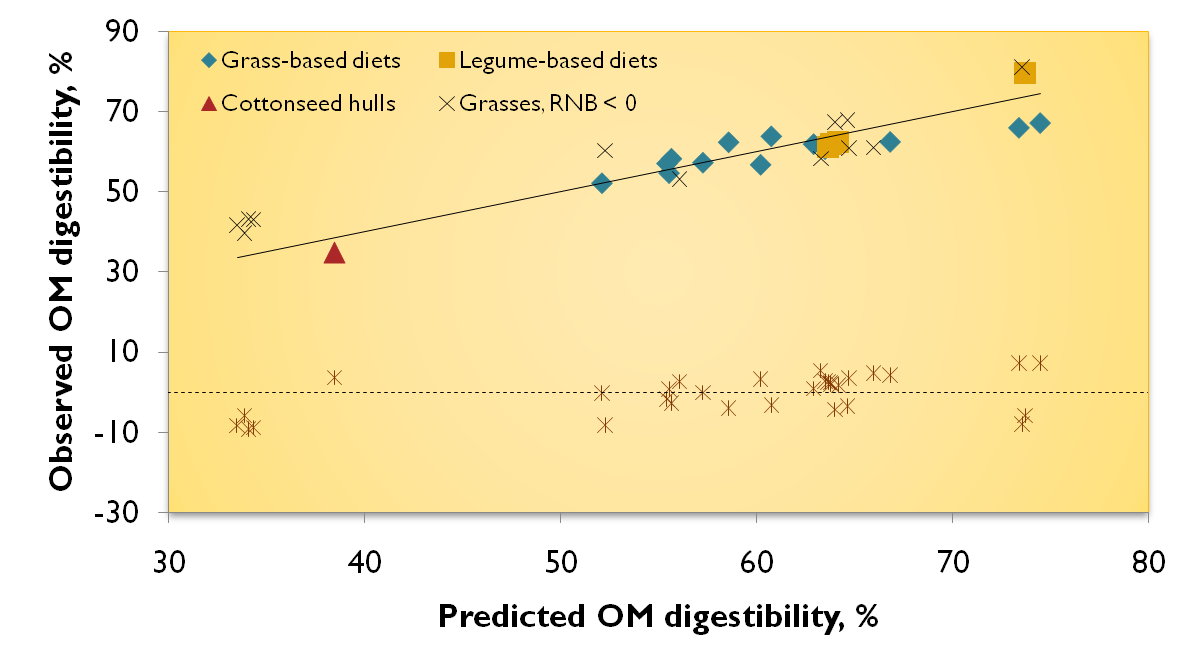
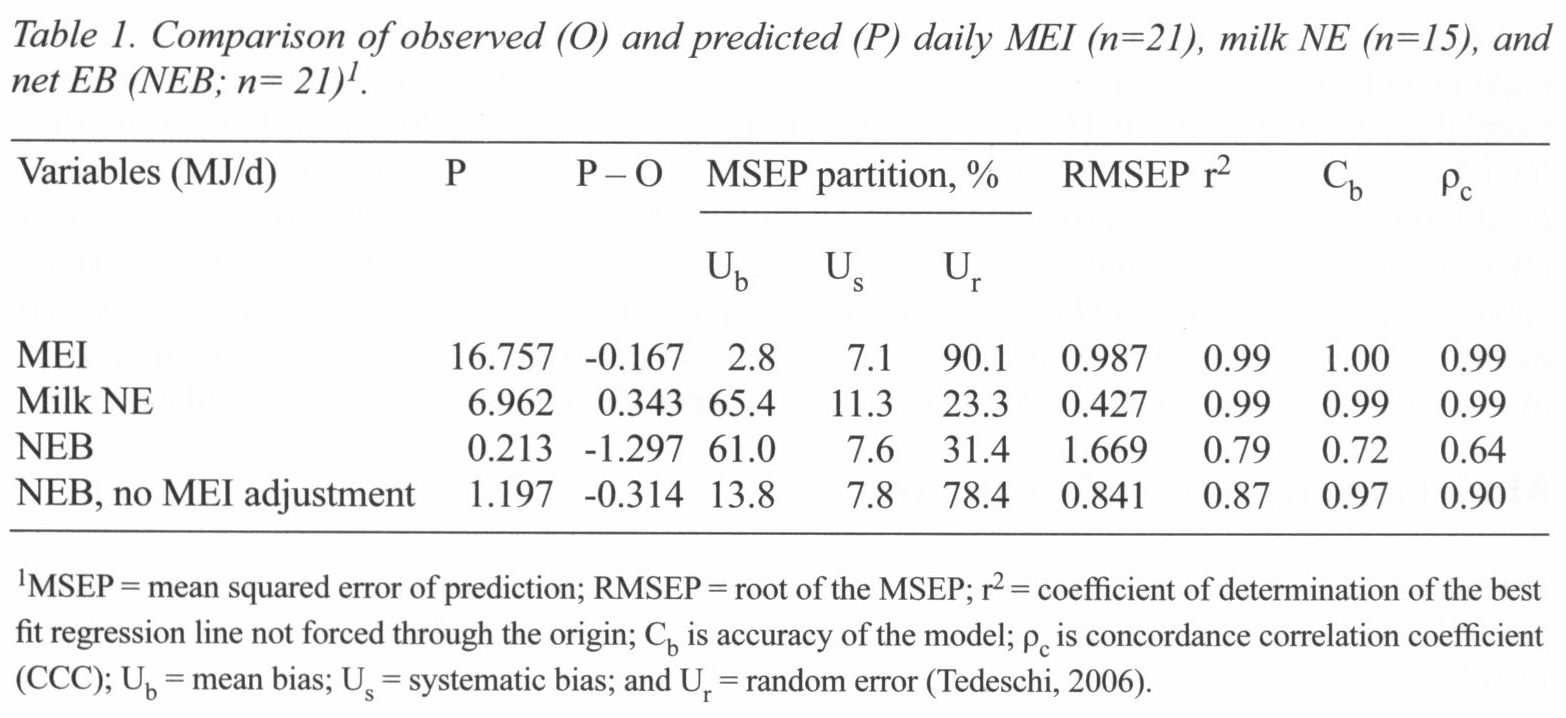
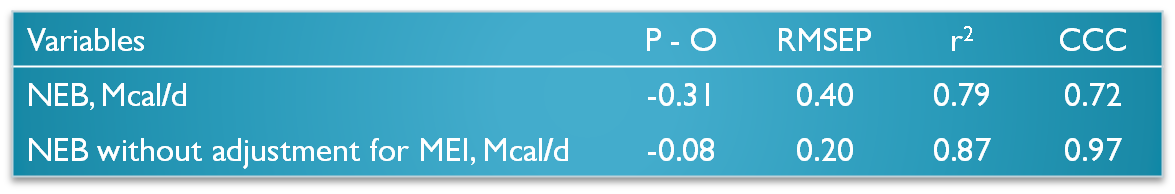
|
|
17
|
- Predicts maintenance requirements for breed type and environmental
conditions
- Computes growth requirements for any mature size for optimum lifetime
production
- Predicts requirements for days pregnant
- Predicts requirements for target milk amount
- Predicts energy reserves fluxes to account for positive or negative
energy balance
|
|
18
|
- Computes carbohydrate and protein fractions available for rumen
fermentation from each feed
- Uses a mechanistic rumen model to predict microbial growth and energy
and protein absorbed from each feed
- Computes intestinal digestibility, TDN, and MP
|
|
19
|
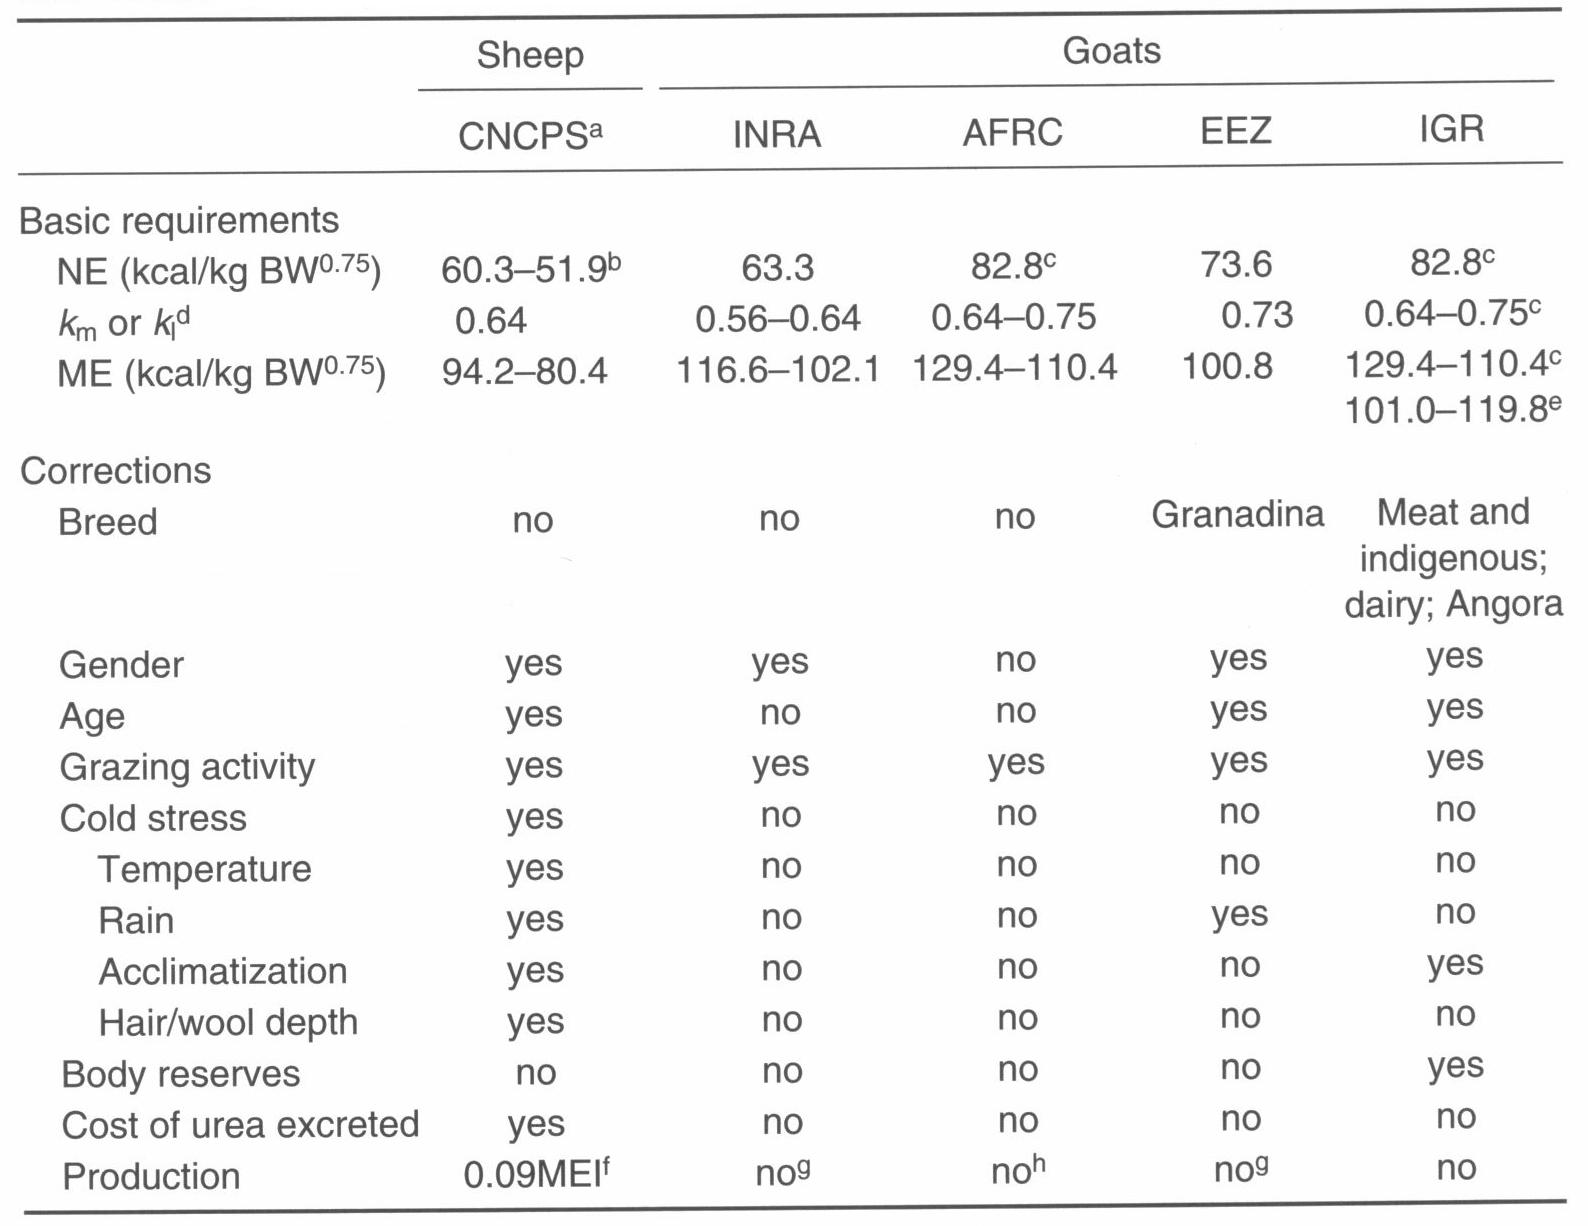
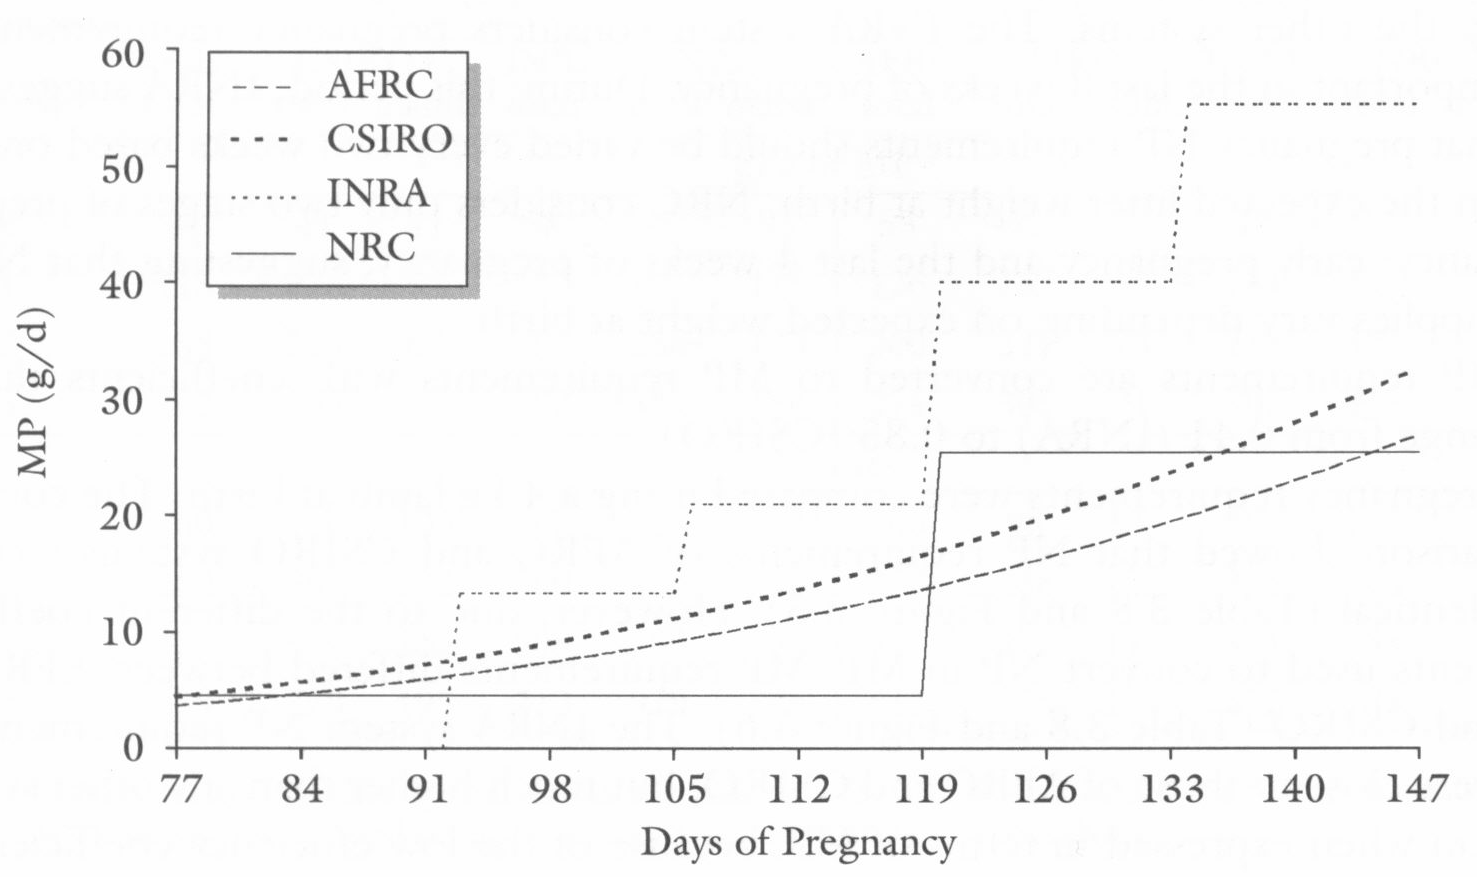
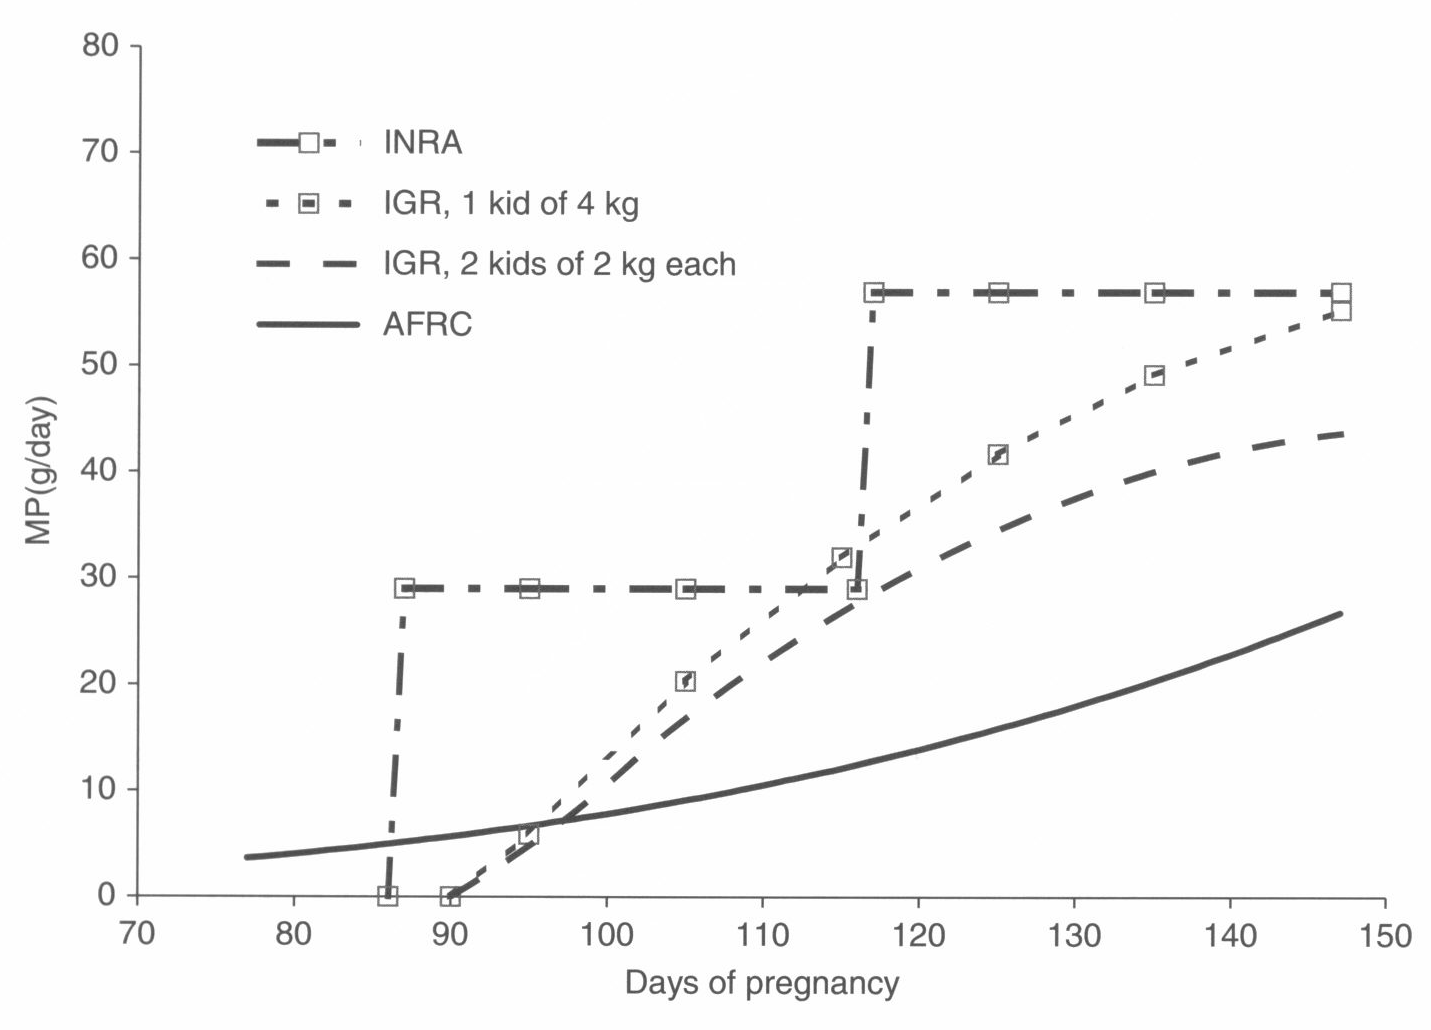
- Current sheep systems:
- more empirical, less flexible than recent cattle systems
- have simplified body reserve models
- do not consider dairy sheep (except for INRA, 1989, 2007)
- Do not account for:
- the effect of intake on feed digestibility (except for AFRC, 1995),
animal requirements (except for CSIRO, 1990), and microbial efficiency,
- the interaction of kp and digestion of feeds,
- the effects of fiber and non fiber bacteria on digestion,
- environmental effects on requirements (except for CSIRO, 1990)
|
|
20
|
|
|
21
|
|
|
22
|
- SRNS is based on the CNCPS framework
- What was modified from the CNCPS?
- ME and MP requirements are based on from CSIRO, INRA, and AFRC
- Composition of the gain for growing sheep is based on CSIRO
- DMI prediction: equations of Pulina et al. (1998)
- NEW body gains or losses of adult sheep
- NEW passage rate equations
- CORRECTED fecal output of CP,
fat, and ash
|
|
23
|
|
|
24
|
|
|
25
|
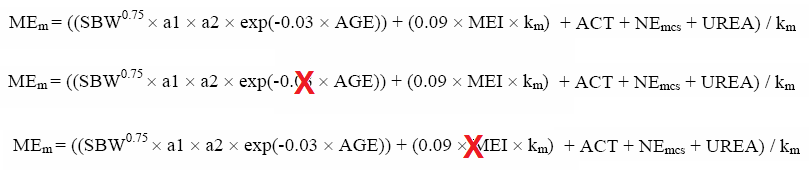
- SBW = shrunk body weight, kg
- S = gender effect, dimensionless
- K = adjustment factor for goats
- a1 = thermoneutral maintenance requirement, Mcal/kg0.75
- a2 = acclimatization effect, dimensionless
- AGE = age of the animal (1 to 0.84 aging from 0 to 6 years)
- ACT = activity (flat and sloped distance)
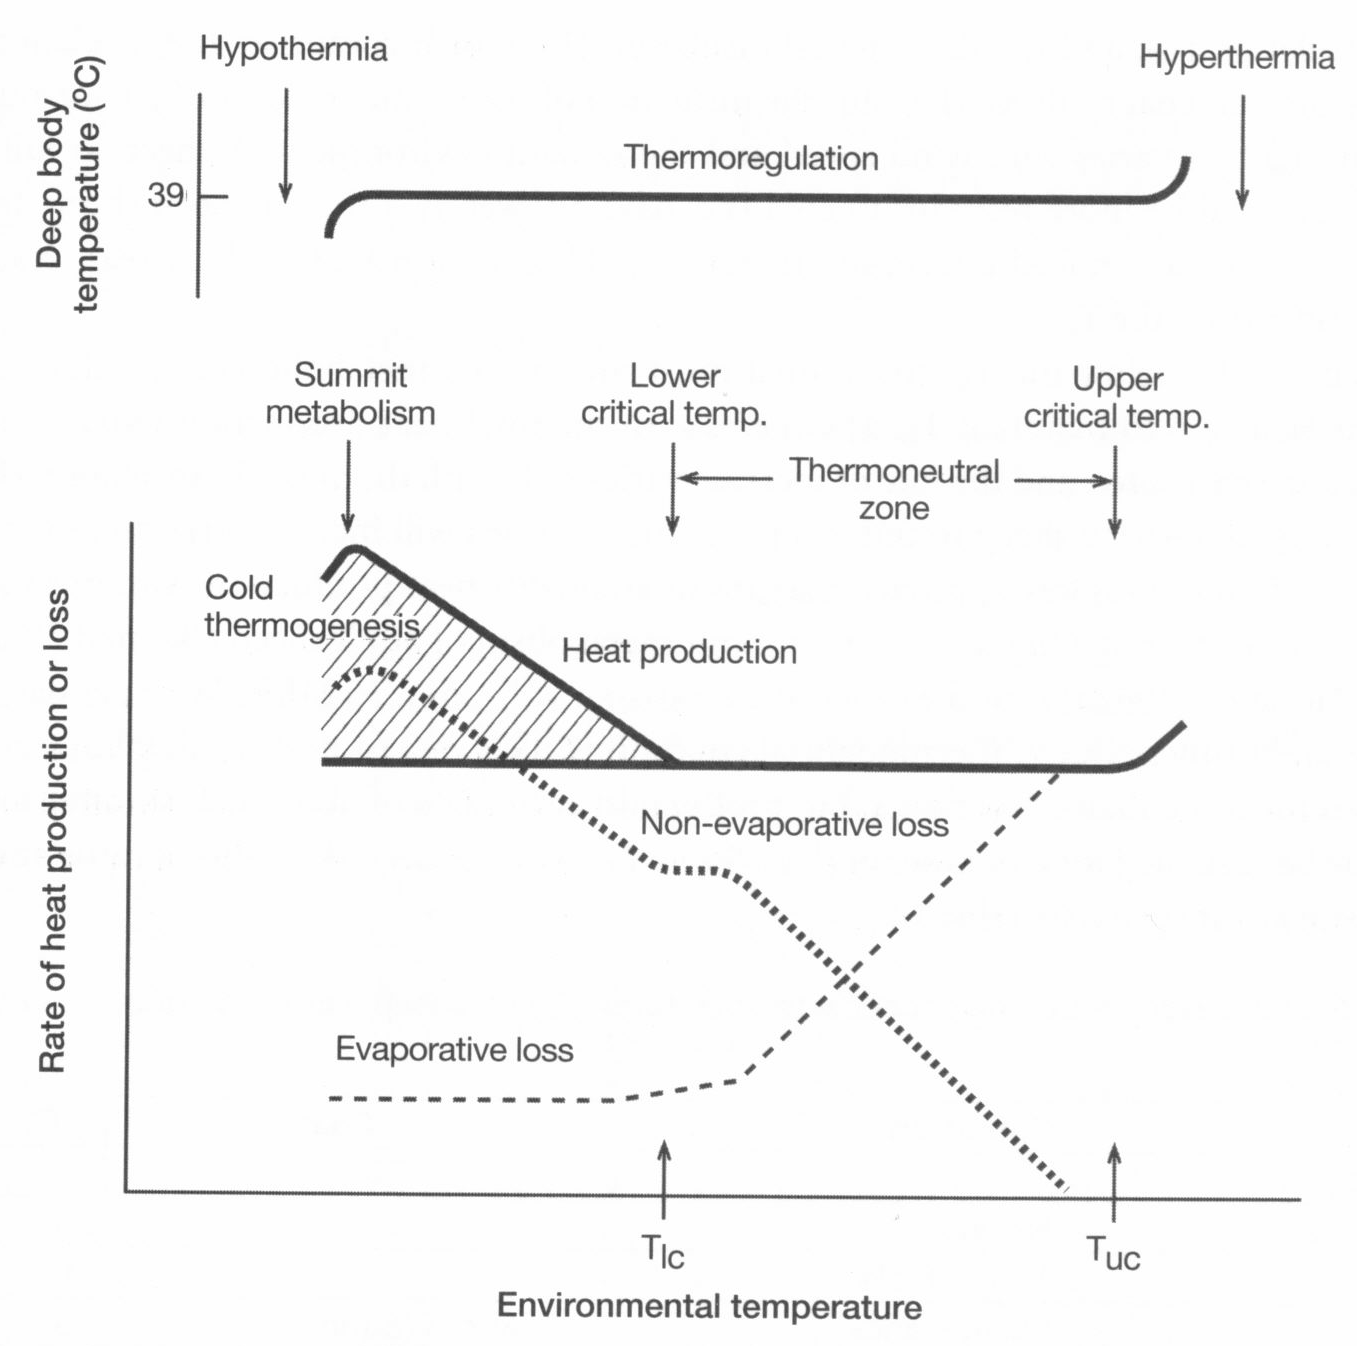
- NEMCS = cold stress (temperature, wind, rain)
- UREA = cost of urea production and excretion
- kM = partial efficiency of ME to NEM (assumed to
be fixed at 0.644)
|
|
26
|
|
|
27
|
- Visceral organ (liver, kidney, stomach, intestine) size is positively
correlated to energy intake
- Visceral organs make up only 8-10% of BW (Burrin et al., 1990; Ortigues
and Doreau, 1995), however:
- 40-60% of protein synthesis and heat production
- Receive up to 50% of cardiac blood flow
- Maintenance requirement is affected:
- Largely by visceral organs
- Limited by size of muscles
|
|
28
|
- Physical activity, Mcal NEM/d
- Based on ARC (1980)
- FBW×(0.00062×Flat distance + 0.00669×Sloped distance)
- Urea cost, Mcal MEM/d
- Based on Tyrrell et al. (1970)
- (ruminal N balance – recycled N + g excess N from MP) × 0.0073
|
|
29
|
|
|
30
|
|
|
31
|
|
|
32
|
- Sheep: K = 1 è a1
× K = 0.062
- Based on Sahlu et al. (2004)
- K = 1.25 for dairy goats è a1× K = 0.0775
- K = 1.17 for Angora goats è a1× K = 0.0725
- K = 1.05 for other goats è a1 × K = 0.0651
|
|
33
|
|
|
34
|
- Urea cost, Mcal MEM/d
- Based on Tyrrell et al. (1970)
- (ruminal N balance – recycled N + g excess N from MP) × 0.0073
- Goats seem to have a higher efficiency in recycling N, urea cost may not
be as high as in cattle and sheep
|
|
35
|
|
|
36
|
|
|
37
|
- 1st term: S-CPE = endogenous CP from scurf and wool, g/d
- 2nd term: U-CPE = urinary endogenous CP, g/d
- 3rd term: F-CPE =
fecal endogenous CP, g/d
|
|
38
|
|
|
39
|
|
|
40
|
- Yn = measured milk yield, kg/d
- PQ = measured milk fat, %
- PP = measured true milk protein, %
- kL = partial efficiency of ME to NE for milk production =
0.644
- kPL = partial efficiency of MP for NP for milk
- Sheep = 0.58 and Goats = 0.64
|
|
41
|
|
|
42
|
|
|
43
|
|
|
44
|
|
|
45
|
|
|
46
|
|
|
47
|
- Based on CSIRO (1990; 2007) with modifications proposed by Freer et al.
(1997)
|
|
48
|
|
|
49
|
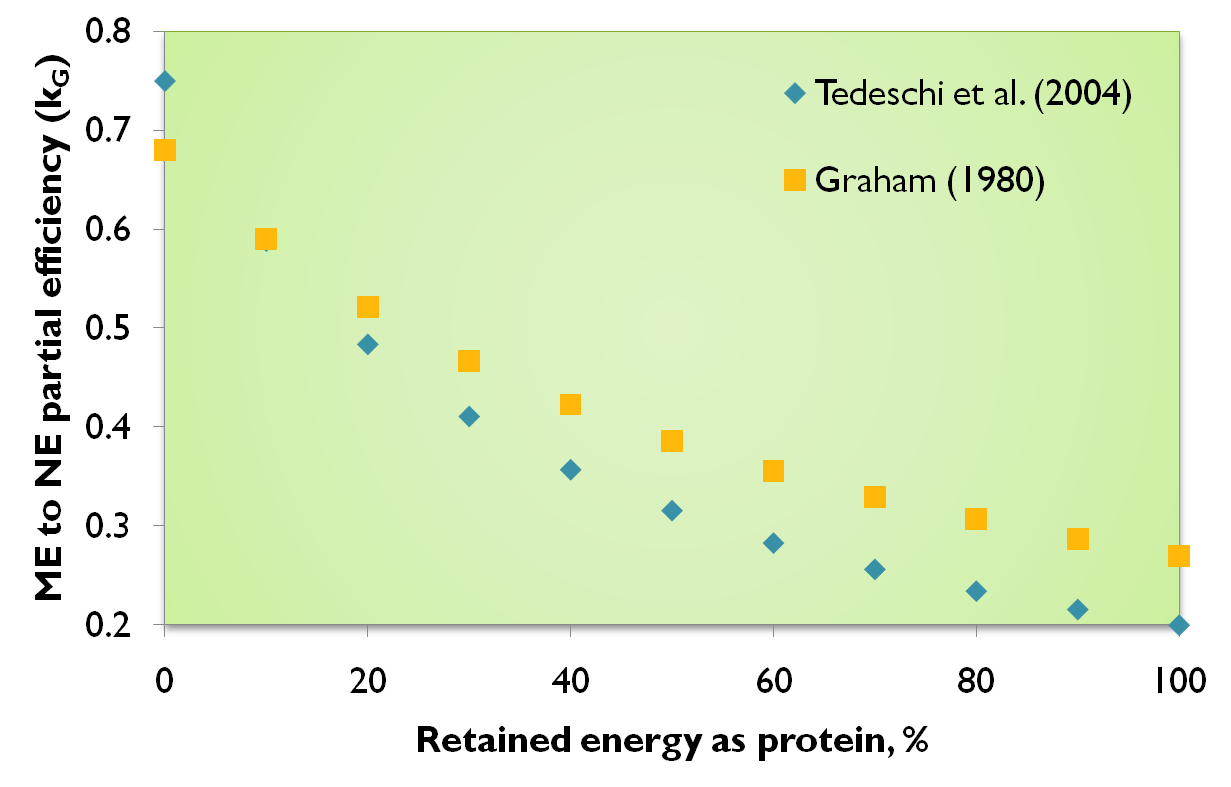
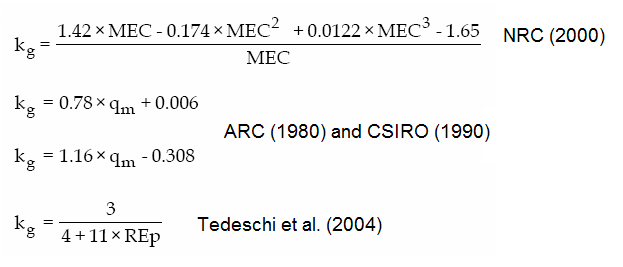
- CNCPS for Sheep used NRC (2000) to compute kG
- SRNS uses a modified Eq. proposed by Tedeschi et al. (2004) and Graham
(1980)
|
|
50
|
|
|
51
|
|
|
52
|
|
|
53
|
|
|
54
|
|
|
55
|
|
|
56
|
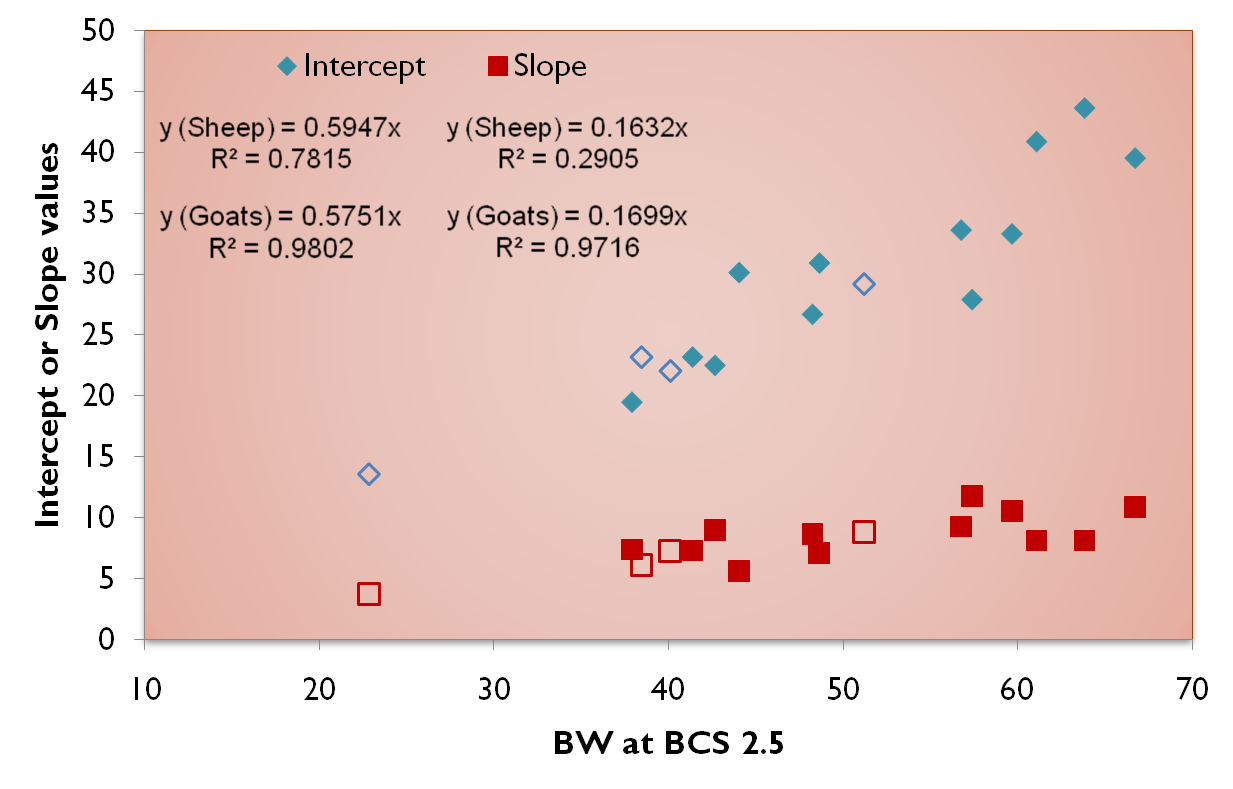
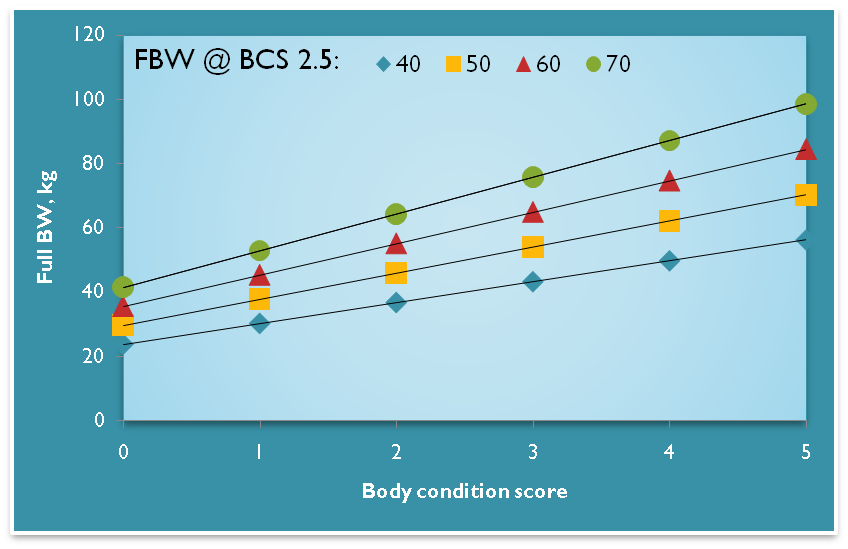
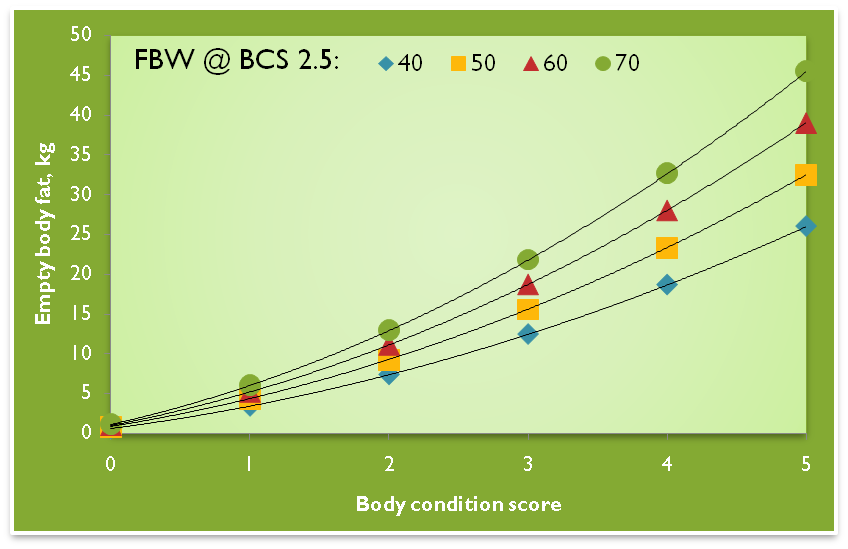
- AF = 0.0269 + 0.0869 × BCS ç Sheep
- AF = 0.0209 + 0.0513 × BCS ç Goats
- AP = -0.0039 × BCS2 + 0.0279 × BCS + 0.1449 ç Sheep + Goats
- EBW = 0.851 × 0.96 × FBW ç Sheep + Goats
- TF = AF × EBW ç
Sheep + Goats
- TP = AP × EBW ç
Sheep + Goats
- TE = 9.4 × TF + 5.7 × TP ç Sheep + Goats
- AF and AP are proportions of empty body in fat and protein, respectively
- EBW is empty body weight (0.851 × SBW), kg
- SBW is shrunk body weight (0.96 × FBW), kg
- FBW is current full body weight, kg
- TF is total body fat, kg
- TP is total body protein, kg
- TE is total body energy, in Mcal of NE
|
|
57
|
- Divide the energy balance by the energy content of each kg of gain or
loss:
- FBWC is FBW changes, g/d
- EB = MEI – (MEM + MEL + MEP), Mcal of
ME/d
- TE is total body energy, Mcal of NE
- kR is the ratio between reserves NE and ME and is 0.6 for
all sheep categories, as suggested by CSIRO (1990).
|
|
58
|
|
|
59
|
|
|
60
|
|
|
61
|
|
|
62
|
|
|
63
|
|
|
64
|
|
|
65
|
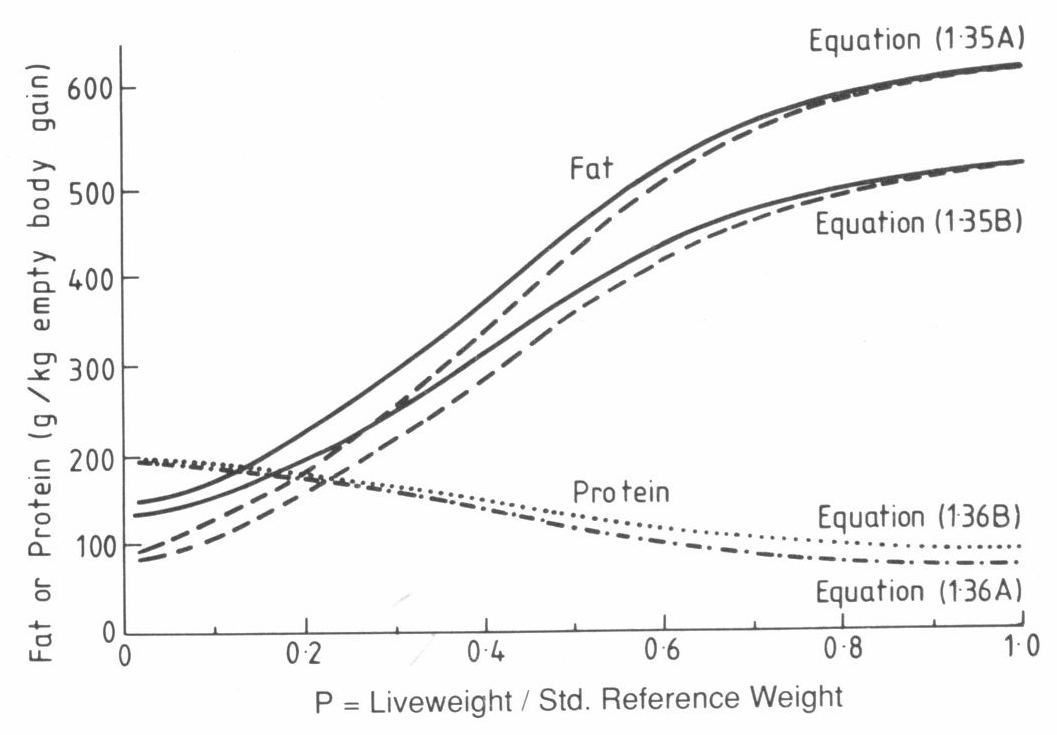
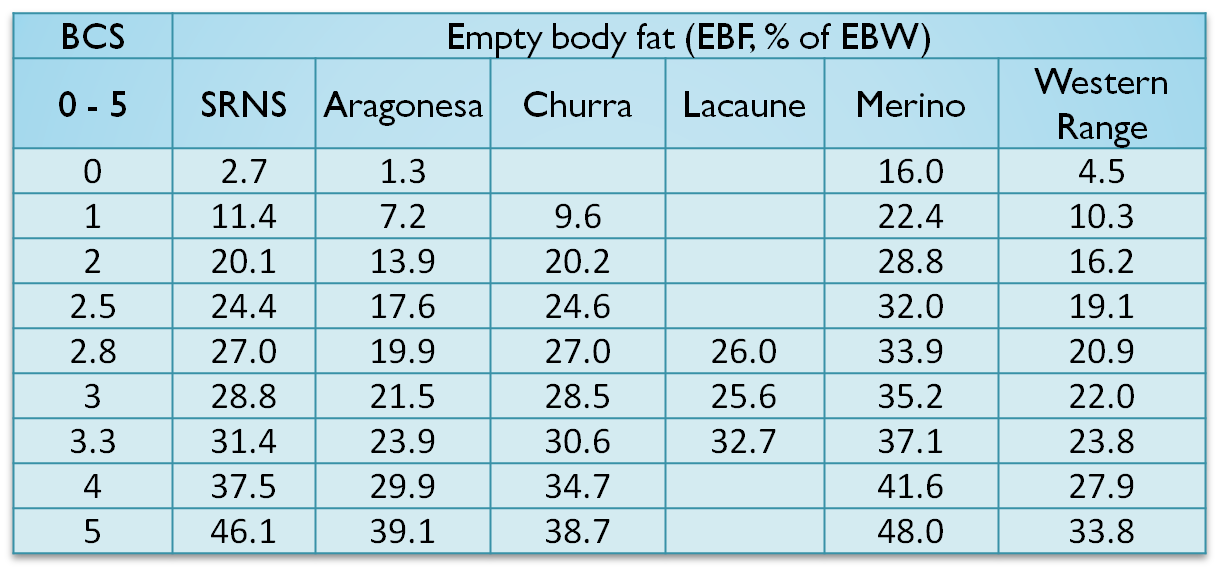
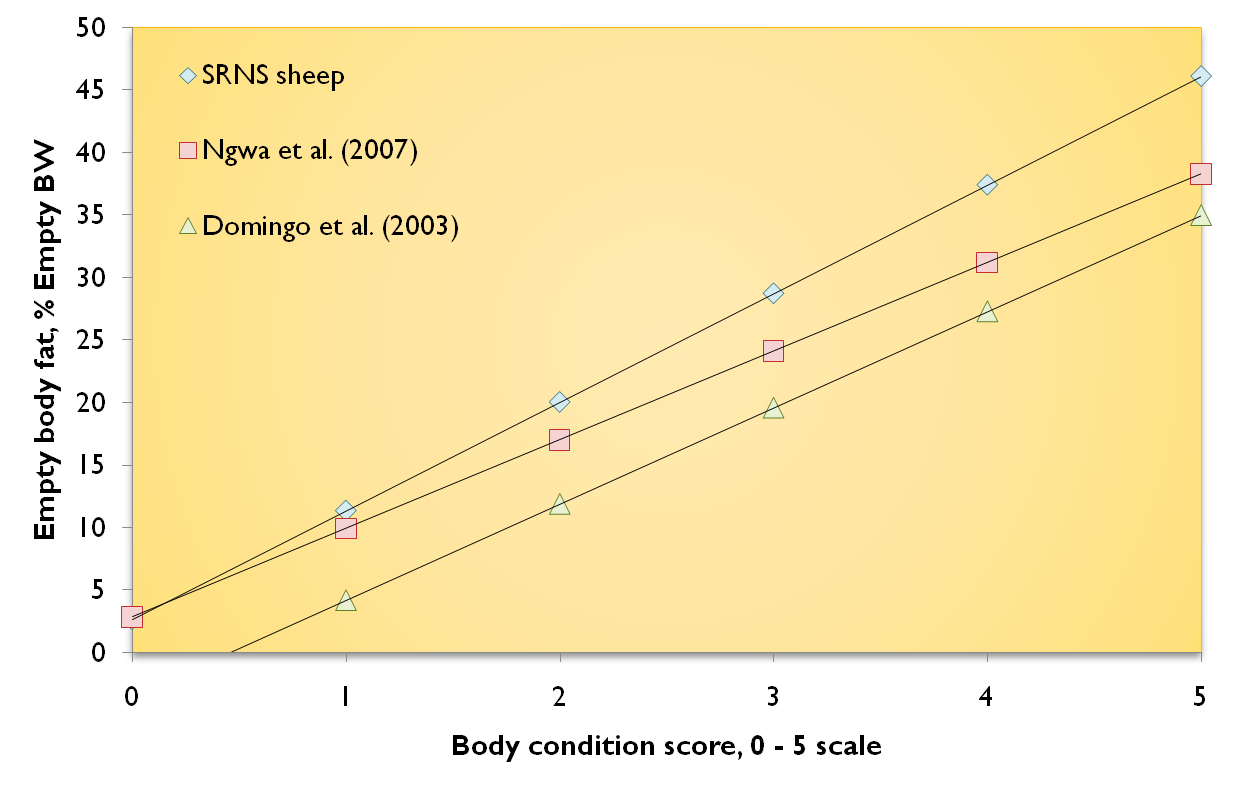
- Fat, % empty BW:
- Sheep è 2.69 +
8.69×BCS (Russel et al., 1969)
- Goats è 2.89 +
7.08×BCS (Ngwa et al., 2007)
- Protein, % empty BW
- Sheep and Goats
- -0.39×BCS2 + 2.79×BCS + 14.49
- Based on Fox et al. (2004) for cattle
|
|
66
|
|
|
67
|
|
|
68
|
|
|
69
|
|
|
70
|
|
|
71
|
|
|
72
|
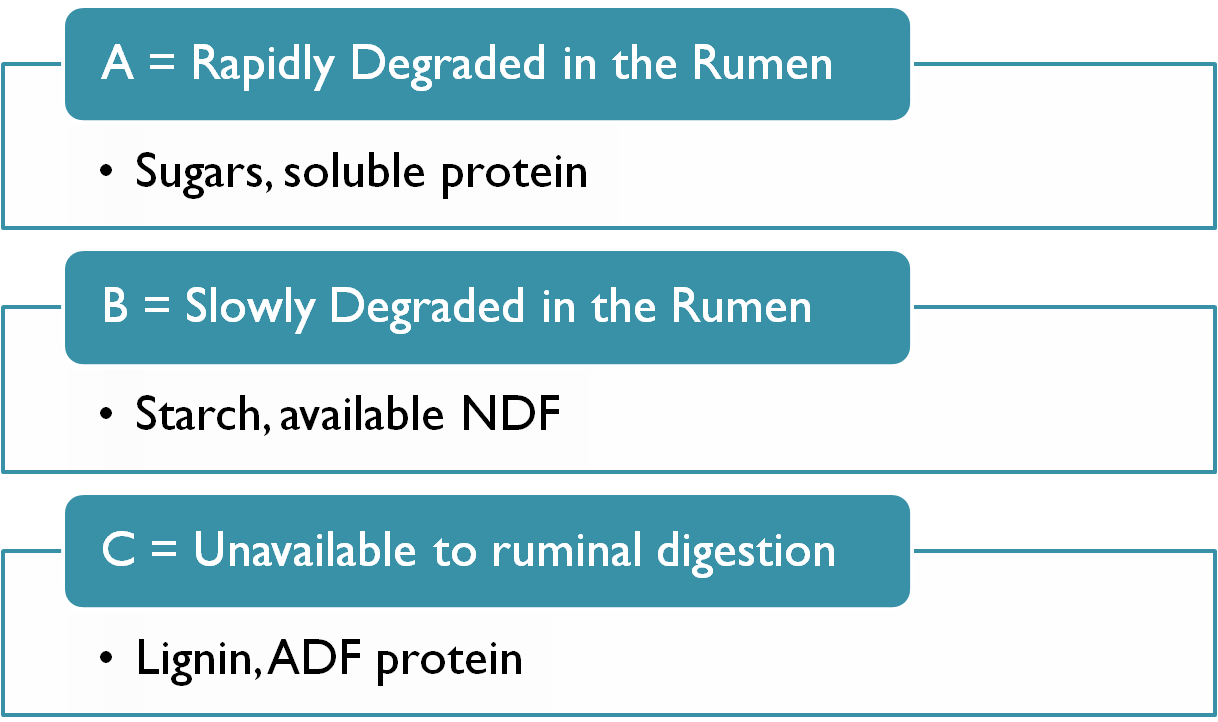
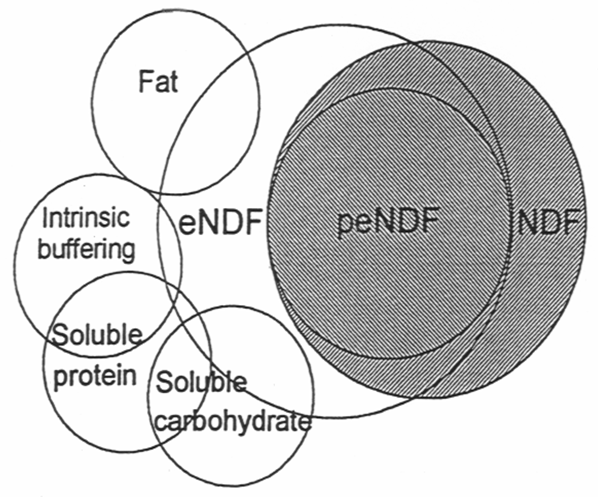
- Crude protein (CP)
- Soluble CP (SolCP)
- Non-protein N (NPN)
- NDF Protein (NDIN)
- ADF Protein (ADIN)
- Dry matter (DM)
- Ash
- NDF
- Ether extract (EE)
- Lignin
- Starch
|
|
73
|
|
|
74
|
|
|
75
|
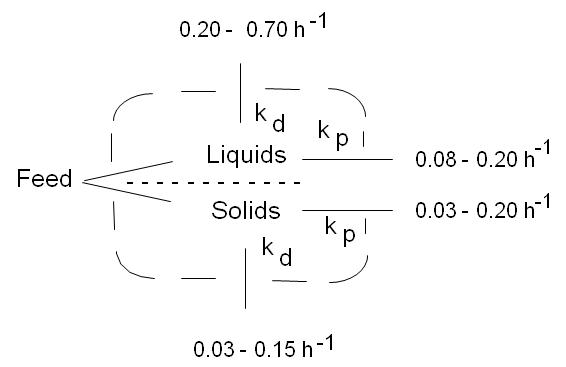
- Assumptions in the model:
- Steady-state condition
- Linear relationship between flows and stocks
|
|
76
|
- Degradation rates are pool and feed specific, and are based on research
data
- Can be altered by degree of processing
- Can be altered by ruminal pH
- The SRNS uses the same feed library of cattle (Fox et al., 2004)
|
|
77
|
|
|
78
|
|
|
79
|
- Cannas et al. (2003, 2004)
- External markers
- Forage kp
- Concentrate kp
- Liquid kp
|
|
80
|
- 36 studies (157 data points):
- cattle (100), sheep (45), water buffalo (4), goats (8)
- Forages (r2 = 53%, SE = 0.80)
- KpF = [1.82×NDFI0.40 × e(0.046×CP)]×AfF
- AfF = 100/(peNDF + 70)
|
|
81
|
|
|
82
|
- 7 studies (36 data points):
- Cattle (26), sheep (6), goats (4)
- Concentrates (r2 = 65%, SE = 1.1)
- KpC = [1.572×KpF – 0.925]×AfC
- AfC = 100/(peNDF + 90)
|
|
83
|
|
|
84
|
- Linear relationship with KpConcentrate
- KpLiquid = 0.976×KpConcentrate + 3.516
(r2 = 45%)
|
|
85
|
|
|
86
|
|
|
87
|
- That portion of the total cell wall that is effective in increasing
rumination and rumen motility, based on:
- particle size
- degree of lignification of NDF
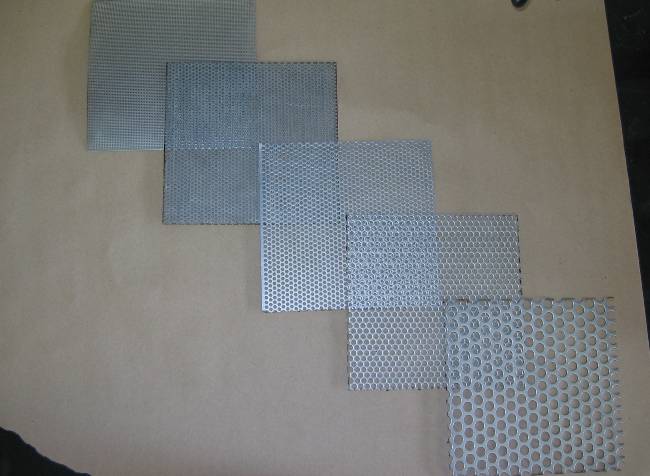
- Measured as % of feed NDF retained on a 1.18 mm screen after vertical
shaking (Mertens, 1997)
|
|
88
|
- 21 x 21 x 11 cm molded plastic box (Economy Pattern, Westminster, MA)
- One solid clear plastic side, one open side for interchangeable sieves
|
|
89
|
|
|
90
|
|
|
91
|
|
|
92
|
- Based on Sniffen et al. (1992) and Knowlton et al. (1998)
- Protein:
- A, B1 and B2 = 100%
- B3 = 80%
- C = 0%
- Carbohydrate:
- B2 (NDF) = 20% due to lack of proper enzymes
- B1 (Starch) based on observation of the feces and in adjusting inputs
to account for predicted and actual animal performance
|
|
93
|
|
|
94
|
|
|
95
|
|
|
96
|
- In the regression between digestible CP and CP intake, the intercept
contains endogenous and fecal microbial CP.
- CNCPS double-accounts for fecal microbial CP
- Assumption of fixed dietary indigestibility of 33% by the CNCPS
|
|
97
|
- Equations used in the CNCPS (Fox et al., 2004)
- Equations used in the SRNS (Cannas et al., 2004)
|
|
98
|
|
|
99
|
- 13 studies in which the in vivo total tract digestibility was measured
in 46 different diets
- 22 forage diets, 23 forage + concentrate diets, 1 cottonseed hulls
- Inputs from the publications
- intake, feed analyses, mean BW
- most publications reported only standard feed analyses (DM, CP,
NDF, ADF, ADL, ash, and EE)
- CHO and CP fractions (such as NDIP and ADIP) required by the CNCPS/SRNS
were reported only in few publications
|
|
100
|
|
|
101
|
|
|
102
|
|
|
103
|
- 6 studies and 29 feeding treatments
- 13 studies with lactating ewes
- 6 diets with forages and 23 with forages + concentrates
- Inputs from the publications
- intake, feed analyses, mean BW, BCS, milk yield and composition
- most publications reported only standard feed analyses (DM, CP,
NDF, ADF, ADL, ash, and EE)
- Energy balance (EG)
- EB = ME intake – (MEM + MEL)
- EB à prediction
of BW gain and loss
|
|
104
|
|
|
105
|
|
|
106
|
|
|
107
|
|
|
108
|
|
|
109
|
|
|
110
|
|
|
111
|
|
|
112
|
|
|
113
|
|
|
114
|
- There is a limitation in the MEM prediction
- AGE, sex and 0.09×MEI adjustment
together may markedly underpredict ADG
- Only AGE or 0.09×MEI adjustment should be used
- Why this happens?
- CNCPS framework-based models predict MEI at actual feeding level and
uses a lower kM than CSIRO (1990)
- UREA correction increases MEM
|
|
115
|
- Partial efficiency of ME to NEG
- kG based on ARC (1980) gives better predictions for growing
lambs and kids
- kG based on Tedeschi et al. (2004)-modified was second best,
but more biologically sound
- The kG of ARC (1980) accounts for feed quality, whereas the
kG of Tedeschi et al. (2004) accounts for variations in gain
composition. Can they be integrated?
|
|
116
|
- The predictions of digestibility had good accuracy for diets with rumen
N balance positive or negative
- The predictions of SBW gains or losses in mature sheep had with good
accuracy for diets with positive or not very negative rumen N balance.
The accuracy was low when the rumen N balance was highly negative
|
|
117
|
- Computer simulations help build our intuition and improve our mental
simulation capability
- Mathematical models can be used on farms to integrate and apply
accumulated scientific knowledge of requirements and supply of energy
and nutrients to attain a sustainable agriculture production
|
|
118
|
|
|
119
|
|
|
120
|
|

 Notes
Notes